Test System and Benchmark Results of the Celsius+ S36 Prisma
- Temperatures are averaged (last minute) from individual core temperature results monitored by the AIDA64 System Stability Test after 15 minutes of the run time.
- FPU load average is used to simulate worst-case scenario load levels similar to Intel Burn Test or OCCT, results marked “0″means thermal limit was reached and the CPU was throttled and thus the results were discarded.
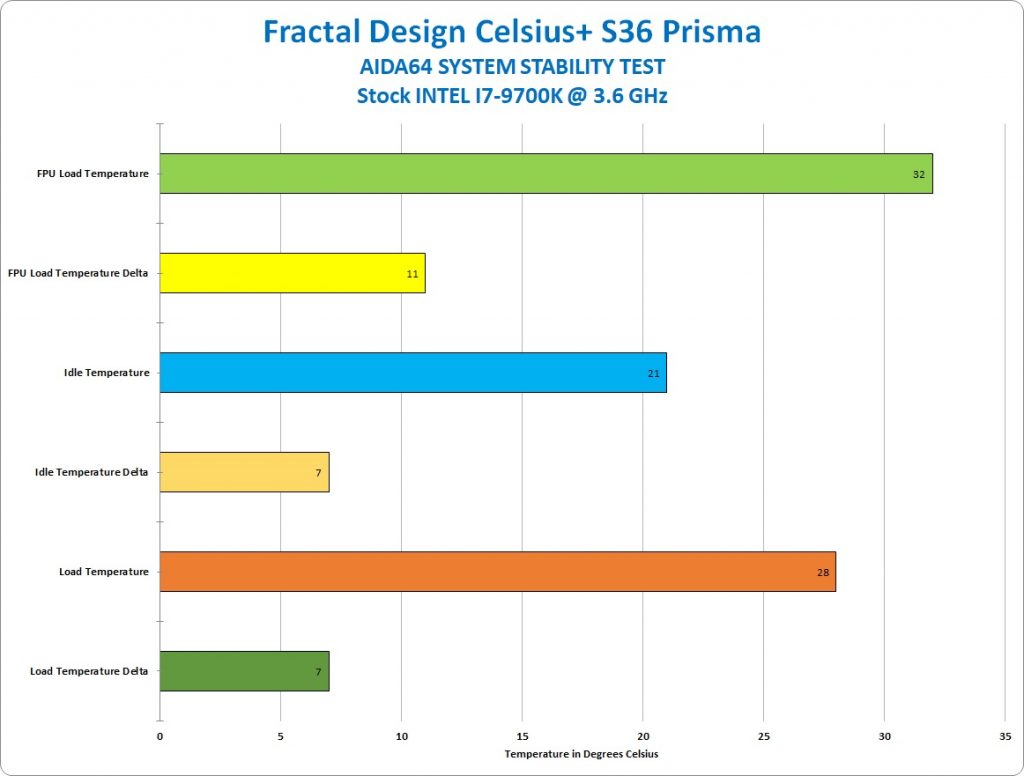
- Stock settings have all power saving features enabled in the motherboard with Vcore set static to 1.232V and set to “Balanced” in the OS. Multiplier at 46 at a stock speed of 3.6GHz.
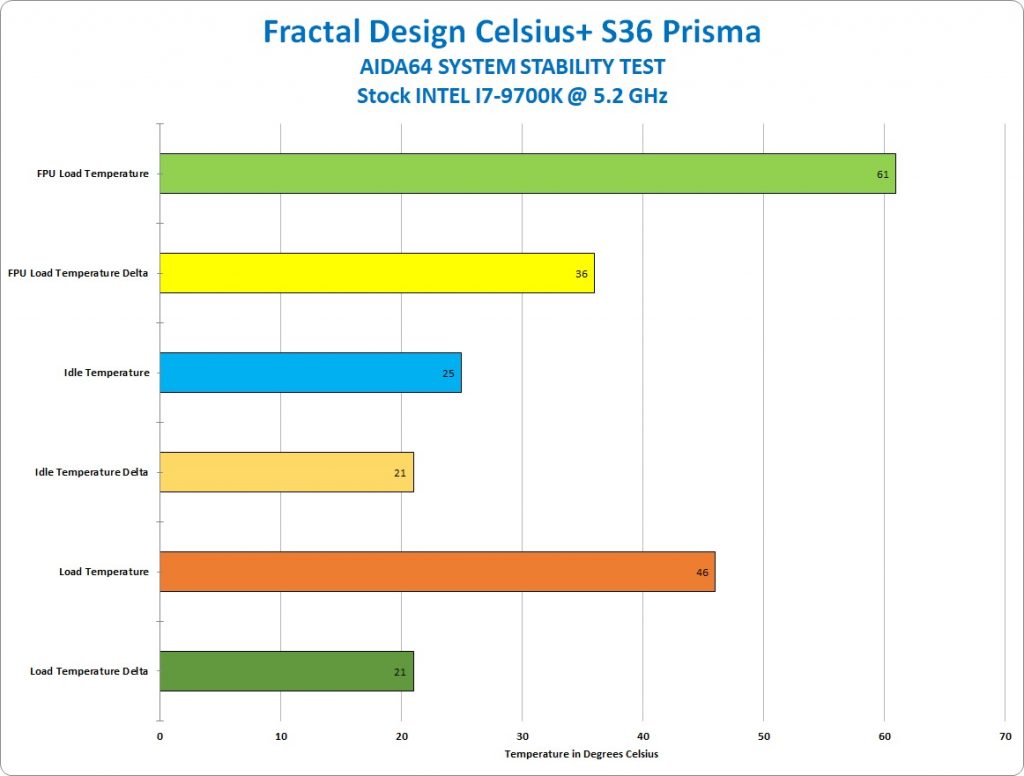
- Overclocked settings have Vcore voltage automatically set to 1.328V with the adjusted multiplier set at 52 to gain overclock at 5.2GHz.
- All tests were taken at least three times to get the final result.
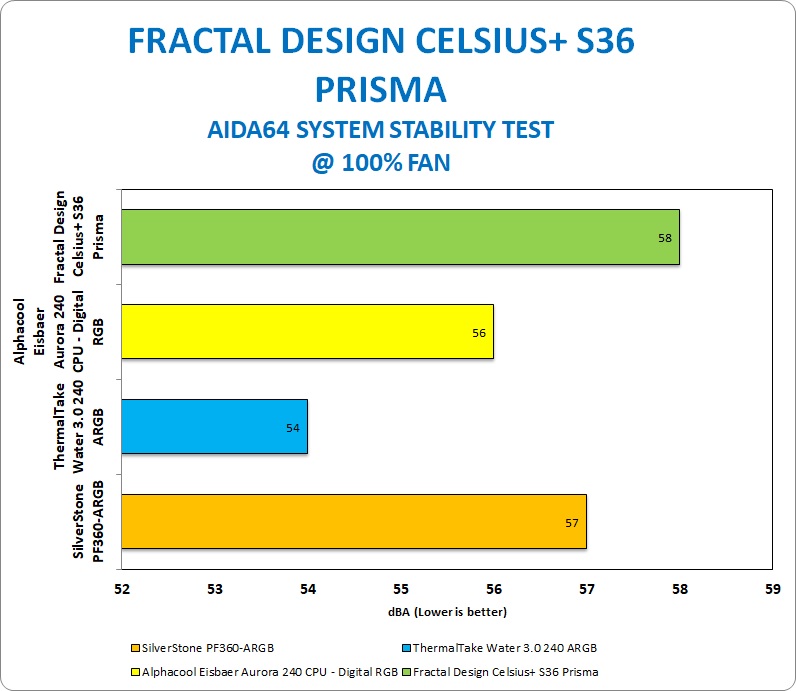
- TDJ 834 was used for noise level measurement in dBA, 20CM away from the center fan exhaust.
The Stock test was run with the CPU set to the stock settings in the BIOS. The radiator fans and pump were set to the normal setting in the Arous BIOS. This allows the fans and pump to spin up and down based on temperature. The stock temperature curves in the BIOS were used. CPU pump and the radiator fans are controlled by the PWM controller so the pump and fans are controllers by the motherboard as needed. Stock Vcore was set to 1.232V. (Stock speed of 3.6GHz)
The Overclock test was done with custom settings. I set the voltage for the CPU at 1.328V for Vcore and set the multiplier on all cores at 52. To hit stable 5.2GHz. The pump was set to PWM and radiator fans were set to full speed in the EVGA BIOS settings.
TDJ 834 was used for noise level measurement in dBA, 20CM away from the center fan exhaust.
| System Configuration | ||
| Component | Product Name | Provided By |
| Case | Open Test Bench | |
| CPU | Intel Core i7 9700K | |
| CPU Cooler | Celsius+ S36 Prisma | Fractal Design |
| Motherboard | EVGA Z390 FTW | EVGA |
| Ram | (2) 8GB Corsair DDR4-3200 CMW16GX4M2C3200C16 | Corsair |
| GPU | MSI GeForce RTX™ 2080 Super GAMING X TRIO | MSI |
| Monitor | BenQ EL2870U 28 inch 4K HDR Gaming Monitor 3840×2160 @ 60 Hz | |
| Hard Drives | Adata XPG SX8200 PRO (512GB) | Adata |
| Power Supply | Thermal Take Tough Power RGB 80 Plus Gold 750W | |
Performance Summary:
Before performing benchmarks, Celsius+ S36 Prisma AIO was completely burned in before taking the measurement. The burn-in time took close to 3 days and only after then I started to see appropriate data from my readings. The burning in of the AIO is essential to get accurate readings.
The stock speed of my CPU was clocked at 3.6GHz and the idle temperatures staid at around 21C. Under the full CPU load, the package max temperature was recorded at 28C. FPU max temperatures reached 32C.
My overclocked system hits a stable 5.2GHz. Idle temperatures while overclocked were observed at 25C. When CPU was under 100% load temperatures reached 46C. When loading FPU to 100% the maximum temperatures were observed at 61C.
The sound level was measured by TDJ 834 sound meter. The measurements were taken at 100% fan speed at about 20 cm away. A maximum noise was produced about 58dBA.
